The stock market offers a wealth of opportunities for investors seeking to grow their wealth, but identifying undervalued stocks with strong growth potential can be a daunting task. One proven investment strategy that has stood the test of time is CANSLIM, a methodology developed by William J. O’Neil, the founder of Investor’s Business Daily. CANSLIM is a disciplined, data-driven approach that combines fundamental and technical analysis to identify stocks with the potential for significant price appreciation. In this 2500-word blog article, we’ll explore the CANSLIM strategy, its components, how it can be used to find undervalued stocks, and practical applications for investors.
What is CANSLIM?CANSLIM is an acronym representing seven key criteria that O’Neil identified as common characteristics of stocks that achieve substantial gains. The strategy was developed through decades of research into the performance of top-performing stocks, particularly those that led major market rallies. By analyzing historical data, O’Neil discovered that winning stocks often exhibited specific financial and technical traits before their significant price increases. These traits form the foundation of the CANSLIM methodology:
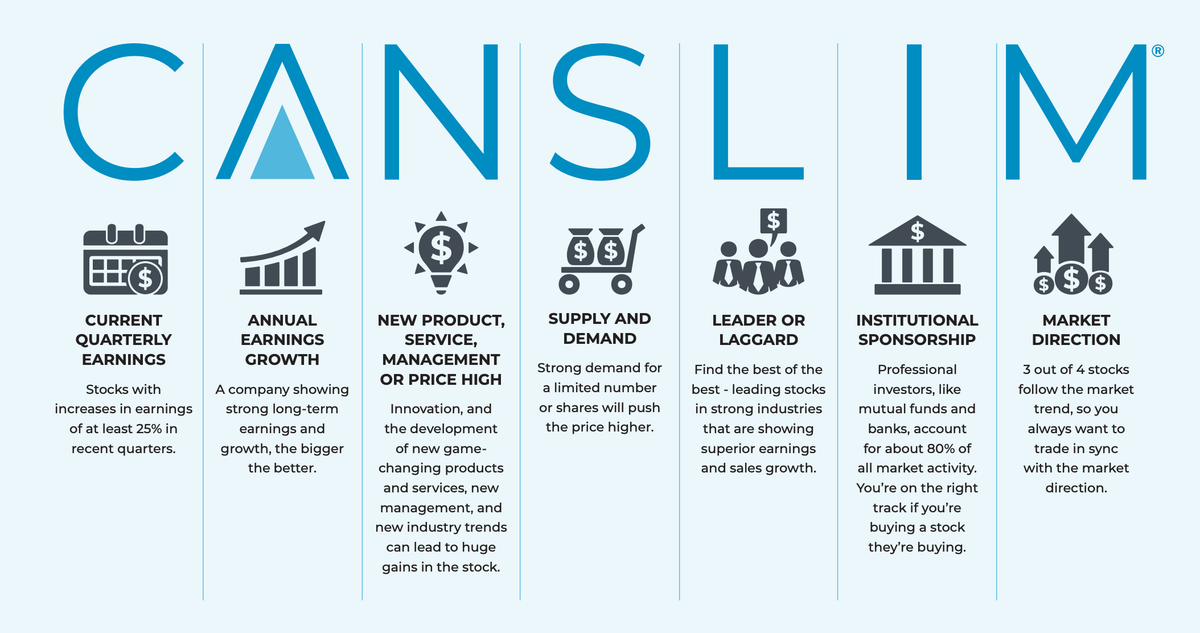
- Current Quarterly Earnings Growth
- Annual Earnings Growth
- New Products, New Management, New Highs
- Supply and Demand
- Leader or Laggard
- Institutional Sponsorship
- Market Direction
CANSLIM is not just a checklist; it’s a dynamic system that blends fundamental analysis (evaluating a company’s financial health) with technical analysis (studying stock price and volume patterns). This dual approach helps investors identify undervalued stocks with strong growth potential before they make significant price moves.
Breaking Down the CANSLIM CriteriaTo effectively use CANSLIM for finding undervalued stocks, it’s essential to understand each component of the strategy and how it contributes to identifying promising investments.1. Current Quarterly Earnings Growth (C)The first criterion focuses on a company’s recent earnings performance. O’Neil emphasized that stocks with strong price appreciation typically show significant quarterly earnings growth. Specifically, CANSLIM looks for companies with at least 25% year-over-year earnings per share (EPS) growth in the most recent quarter. Additionally, revenue growth should also be robust, ideally in the range of 25% or higher.Why it matters: Strong earnings growth signals that a company is performing well operationally and is likely gaining market share or benefiting from favorable industry trends. Undervalued stocks often exhibit strong earnings growth that hasn’t yet been fully recognized by the market, making them attractive candidates for investment.Application: Use financial websites or stock screeners to filter for companies with at least 25% quarterly EPS growth. Compare the company’s performance to its industry peers to ensure the growth is sustainable and not a one-time anomaly.2. Annual Earnings Growth (A)In addition to quarterly performance, CANSLIM emphasizes consistent annual earnings growth over the past three to five years. O’Neil recommends looking for companies with annual EPS growth of 25% or more over this period. This ensures that the company has a track record of sustained profitability and is not just benefiting from a temporary boost.Why it matters: Consistent annual earnings growth indicates a company’s ability to deliver long-term value. Undervalued stocks with strong annual earnings growth are often overlooked by the broader market, providing opportunities for investors to buy in before the stock gains wider recognition.Application: Review a company’s historical financial statements to confirm steady annual EPS growth. Look for companies with a compounded annual growth rate (CAGR) of at least 25% over the past three to five years.3. New Products, New Management, New Highs (N)The “N” in CANSLIM stands for new developments that can act as catalysts for stock price growth. These include:
- New products or services: Innovative offerings that drive revenue growth.
- New management: A fresh leadership team with a proven track record of success.
- New price highs: Stocks breaking out to new 52-week or all-time highs, often signaling strong momentum.
Why it matters: New developments can propel a company’s growth and attract investor attention. Stocks reaching new highs are often undervalued relative to their future potential, as the market may not yet have priced in the impact of these catalysts.Application: Monitor news releases, earnings calls, and industry reports for companies launching new products or undergoing significant management changes. Use technical analysis to identify stocks breaking out to new highs with strong volume.4. Supply and Demand (S)The supply and demand criterion focuses on the stock’s share structure and trading volume. Stocks with fewer shares outstanding (low float) are more likely to experience significant price movements when demand increases. CANSLIM favors stocks with tight supply and high trading volume during price breakouts, as this indicates strong investor interest.Why it matters: Stocks with limited supply and high demand can experience rapid price appreciation, especially if they are undervalued. High volume during breakouts confirms that institutional investors are accumulating shares, which can drive prices higher.Application: Look for stocks with a relatively low number of outstanding shares and monitor trading volume for spikes during price breakouts. Avoid stocks with excessive share dilution or heavy insider selling.5. Leader or Laggard (L)CANSLIM emphasizes investing in leading stocks within leading industries. A leader is a company that outperforms its peers in terms of earnings growth, market share, and stock price performance. O’Neil advises avoiding laggards—stocks that underperform their industry or the broader market.Why it matters: Leading stocks are often undervalued relative to their growth potential, as they are at the forefront of industry trends. Investing in leaders increases the likelihood of capturing significant gains while avoiding weaker companies.Application: Use relative strength indicators to identify stocks outperforming their industry or the S&P 500. Focus on companies in top-performing sectors, such as technology, healthcare, or consumer discretionary, depending on market conditions.6. Institutional Sponsorship (I)Institutional investors, such as mutual funds, pension funds, and hedge funds, have significant resources to research and invest in high-quality stocks. CANSLIM looks for stocks with increasing institutional ownership, as this indicates that large investors are accumulating shares.Why it matters: Institutional buying can drive stock prices higher, especially for undervalued stocks that are just beginning to attract attention. However, O’Neil cautions against stocks with excessive institutional ownership, as this could indicate the stock is already widely discovered.Application: Check SEC filings (e.g., 13F forms) or use investment platforms to track institutional ownership trends. Look for stocks with moderate but increasing institutional sponsorship.7. Market Direction (M)The final criterion emphasizes the importance of overall market conditions. O’Neil found that approximately 75% of a stock’s price movement is influenced by the broader market. CANSLIM advises investing during confirmed market uptrends and avoiding new purchases during downtrends or corrections.Why it matters: Even the best undervalued stocks can struggle in a bearish market. Timing entries during favorable market conditions increases the probability of success.Application: Use technical indicators like the 50-day and 200-day moving averages of major indices (e.g., S&P 500, Nasdaq) to gauge market direction. Avoid aggressive buying during market corrections or bear markets.
Using CANSLIM to Find Undervalued StocksUndervalued stocks are those trading below their intrinsic value, often due to market inefficiencies or lack of investor awareness. CANSLIM’s combination of fundamental and technical criteria makes it an effective tool for identifying these opportunities. Here’s how to apply CANSLIM to find undervalued stocks:Step 1: Screen for Fundamental StrengthUse stock screeners (e.g., Finviz, Zacks, or Investor’s Business Daily tools) to filter for companies meeting CANSLIM’s fundamental criteria:
- Earnings Growth: Quarterly EPS growth of 25% or more and annual EPS growth of 25% or more over three to five years.
- Sales Growth: Strong revenue growth to support earnings.
- Return on Equity (ROE): Look for ROE above 15%, indicating efficient use of capital.
- Debt Levels: Prefer companies with low debt-to-equity ratios to ensure financial stability.
This step narrows the universe of stocks to those with strong financials, increasing the likelihood of finding undervalued gems.Step 2: Identify CatalystsResearch companies passing the fundamental screen for new developments, such as product launches, management changes, or industry tailwinds. These catalysts can signal that a stock is poised for growth, even if it’s currently undervalued. For example, a biotech company nearing FDA approval for a new drug or a tech firm launching a disruptive product could be undervalued relative to its future potential.Step 3: Analyze Technical PatternsOnce you’ve identified fundamentally strong stocks with catalysts, use technical analysis to confirm buy points. CANSLIM emphasizes buying stocks as they break out from specific chart patterns, such as:
- Cup-with-Handle: A consolidation pattern resembling a “U” shape followed by a short pullback (handle). The buy point is when the stock breaks above the handle’s high with strong volume.
- Flat Base: A period of sideways price movement after a prior uptrend. The buy point is when the stock breaks above the base’s high.
- Double Bottom: A “W” shaped pattern indicating two failed attempts to break lower. The buy point is when the stock breaks above the middle peak of the “W.”
These patterns signal that a stock is gaining momentum and may be undervalued relative to its breakout potential.Step 4: Confirm Institutional Support and Market ConditionsBefore buying, verify that the stock has increasing institutional ownership and that the broader market is in an uptrend. Use tools like MarketSmith or Yahoo Finance to track institutional activity and monitor market indices for bullish signals.Step 5: Monitor and Manage RiskCANSLIM emphasizes disciplined risk management. O’Neil recommends:
- Cutting Losses Quickly: Sell a stock if it falls 7-8% below your purchase price to limit losses.
- Position Sizing: Avoid over-concentration in a single stock. Allocate capital across a diversified portfolio.
- Trailing Stops: Use trailing stops to lock in gains as the stock rises.
By combining these steps, investors can use CANSLIM to systematically identify undervalued stocks with strong upside potential.
Practical Application of CANSLIM: A Case StudyTo illustrate how CANSLIM can be applied, let’s consider a hypothetical example of identifying an undervalued stock in 2025.Example: TechTrend Innovations (Fictional)Step 1: Fundamental Screening
- TechTrend Innovations, a mid-cap technology company, reports 35% year-over-year EPS growth in its latest quarter and 30% annual EPS growth over the past five years.
- Revenue growth is 28% year-over-year, and the company has an ROE of 20% with a low debt-to-equity ratio of 0.3.
- The stock passes the “C” and “A” criteria of CANSLIM.
Step 2: Identifying Catalysts
- TechTrend recently launched a new AI-powered software platform that has gained traction in the enterprise market, satisfying the “N” criterion.
- The company hired a new CEO with a track record of scaling tech firms, further supporting the “N” factor.
Step 3: Technical Analysis
- The stock forms a cup-with-handle pattern over 12 weeks, with a buy point at $50. It breaks out above $50 on high volume, meeting the “S” criterion.
- The stock is also reaching new 52-week highs, aligning with the “N” criterion for new highs.
Step 4: Institutional and Market Confirmation
- Institutional ownership has increased by 15% over the past two quarters, satisfying the “I” criterion.
- The S&P 500 is in a confirmed uptrend, with its 50-day moving average above the 200-day moving average, meeting the “M” criterion.
- TechTrend is a leader in the AI software sector, which is outperforming other industries, fulfilling the “L” criterion.
Step 5: Risk Management
- An investor buys TechTrend at $50 and sets a stop-loss at $46.50 (7% below the buy point).
- The investor allocates 10% of their portfolio to the stock to manage risk.
Outcome: TechTrend’s stock rises 40% over the next six months as its AI platform gains market share. The investor uses a trailing stop to lock in gains, exiting at $65 for a 30% profit.This case study demonstrates how CANSLIM’s structured approach can help investors identify undervalued stocks and capitalize on their growth potential while managing risk.
Benefits and Limitations of CANSLIMBenefits
- Data-Driven Approach: CANSLIM’s reliance on historical data and specific criteria reduces emotional decision-making.
- Focus on Growth: By targeting companies with strong earnings and catalysts, CANSLIM identifies stocks with high upside potential.
- Risk Management: The strategy’s emphasis on cutting losses and timing market entries minimizes downside risk.
- Adaptability: CANSLIM can be applied across different market cycles and industries, making it versatile.
Limitations
- Time-Intensive: Screening for CANSLIM stocks requires significant research and analysis.
- Market Dependence: The strategy performs best in bullish markets, and returns may be limited during bearish periods.
- False Signals: Breakout patterns can fail, leading to losses if not managed properly.
- High Volatility: Growth stocks targeted by CANSLIM can be volatile, requiring strong discipline to follow stop-loss rules.
Tips for Success with CANSLIM
- Use Reliable Tools: Leverage stock screeners, charting software (e.g., TradingView, MarketSmith), and financial news platforms to streamline research.
- Stay Disciplined: Follow CANSLIM’s rules strictly, especially regarding stop-losses and market timing.
- Learn Technical Analysis: Understanding chart patterns and volume trends is critical for identifying buy points.
- Stay Informed: Monitor industry trends and macroeconomic conditions to identify leading sectors and market uptrends.
- Practice Patience: Wait for confirmed breakouts and avoid chasing stocks that have already made significant moves.
CANSLIM is a powerful investment strategy that combines fundamental and technical analysis to identify undervalued stocks with strong growth potential. By focusing on companies with robust earnings, innovative catalysts, and favorable technical patterns, investors can uncover opportunities that the broader market may have overlooked. While CANSLIM requires time, discipline, and a solid understanding of market dynamics, its structured approach has helped countless investors achieve significant returns. Whether you’re a seasoned investor or a beginner, CANSLIM offers a roadmap for navigating the complexities of the stock market. By diligently applying its seven criteria—Current Earnings, Annual Earnings, New Developments, Supply and Demand, Leader or Laggard, Institutional Sponsorship, and Market Direction—you can increase your chances of finding undervalued stocks poised for substantial gains. Start small, practice risk management, and refine your skills over time to harness the full potential of CANSLIM in your investment journey.